Traffic Intelligence for Local Government

Finally know if your traffic interventions are actually working.

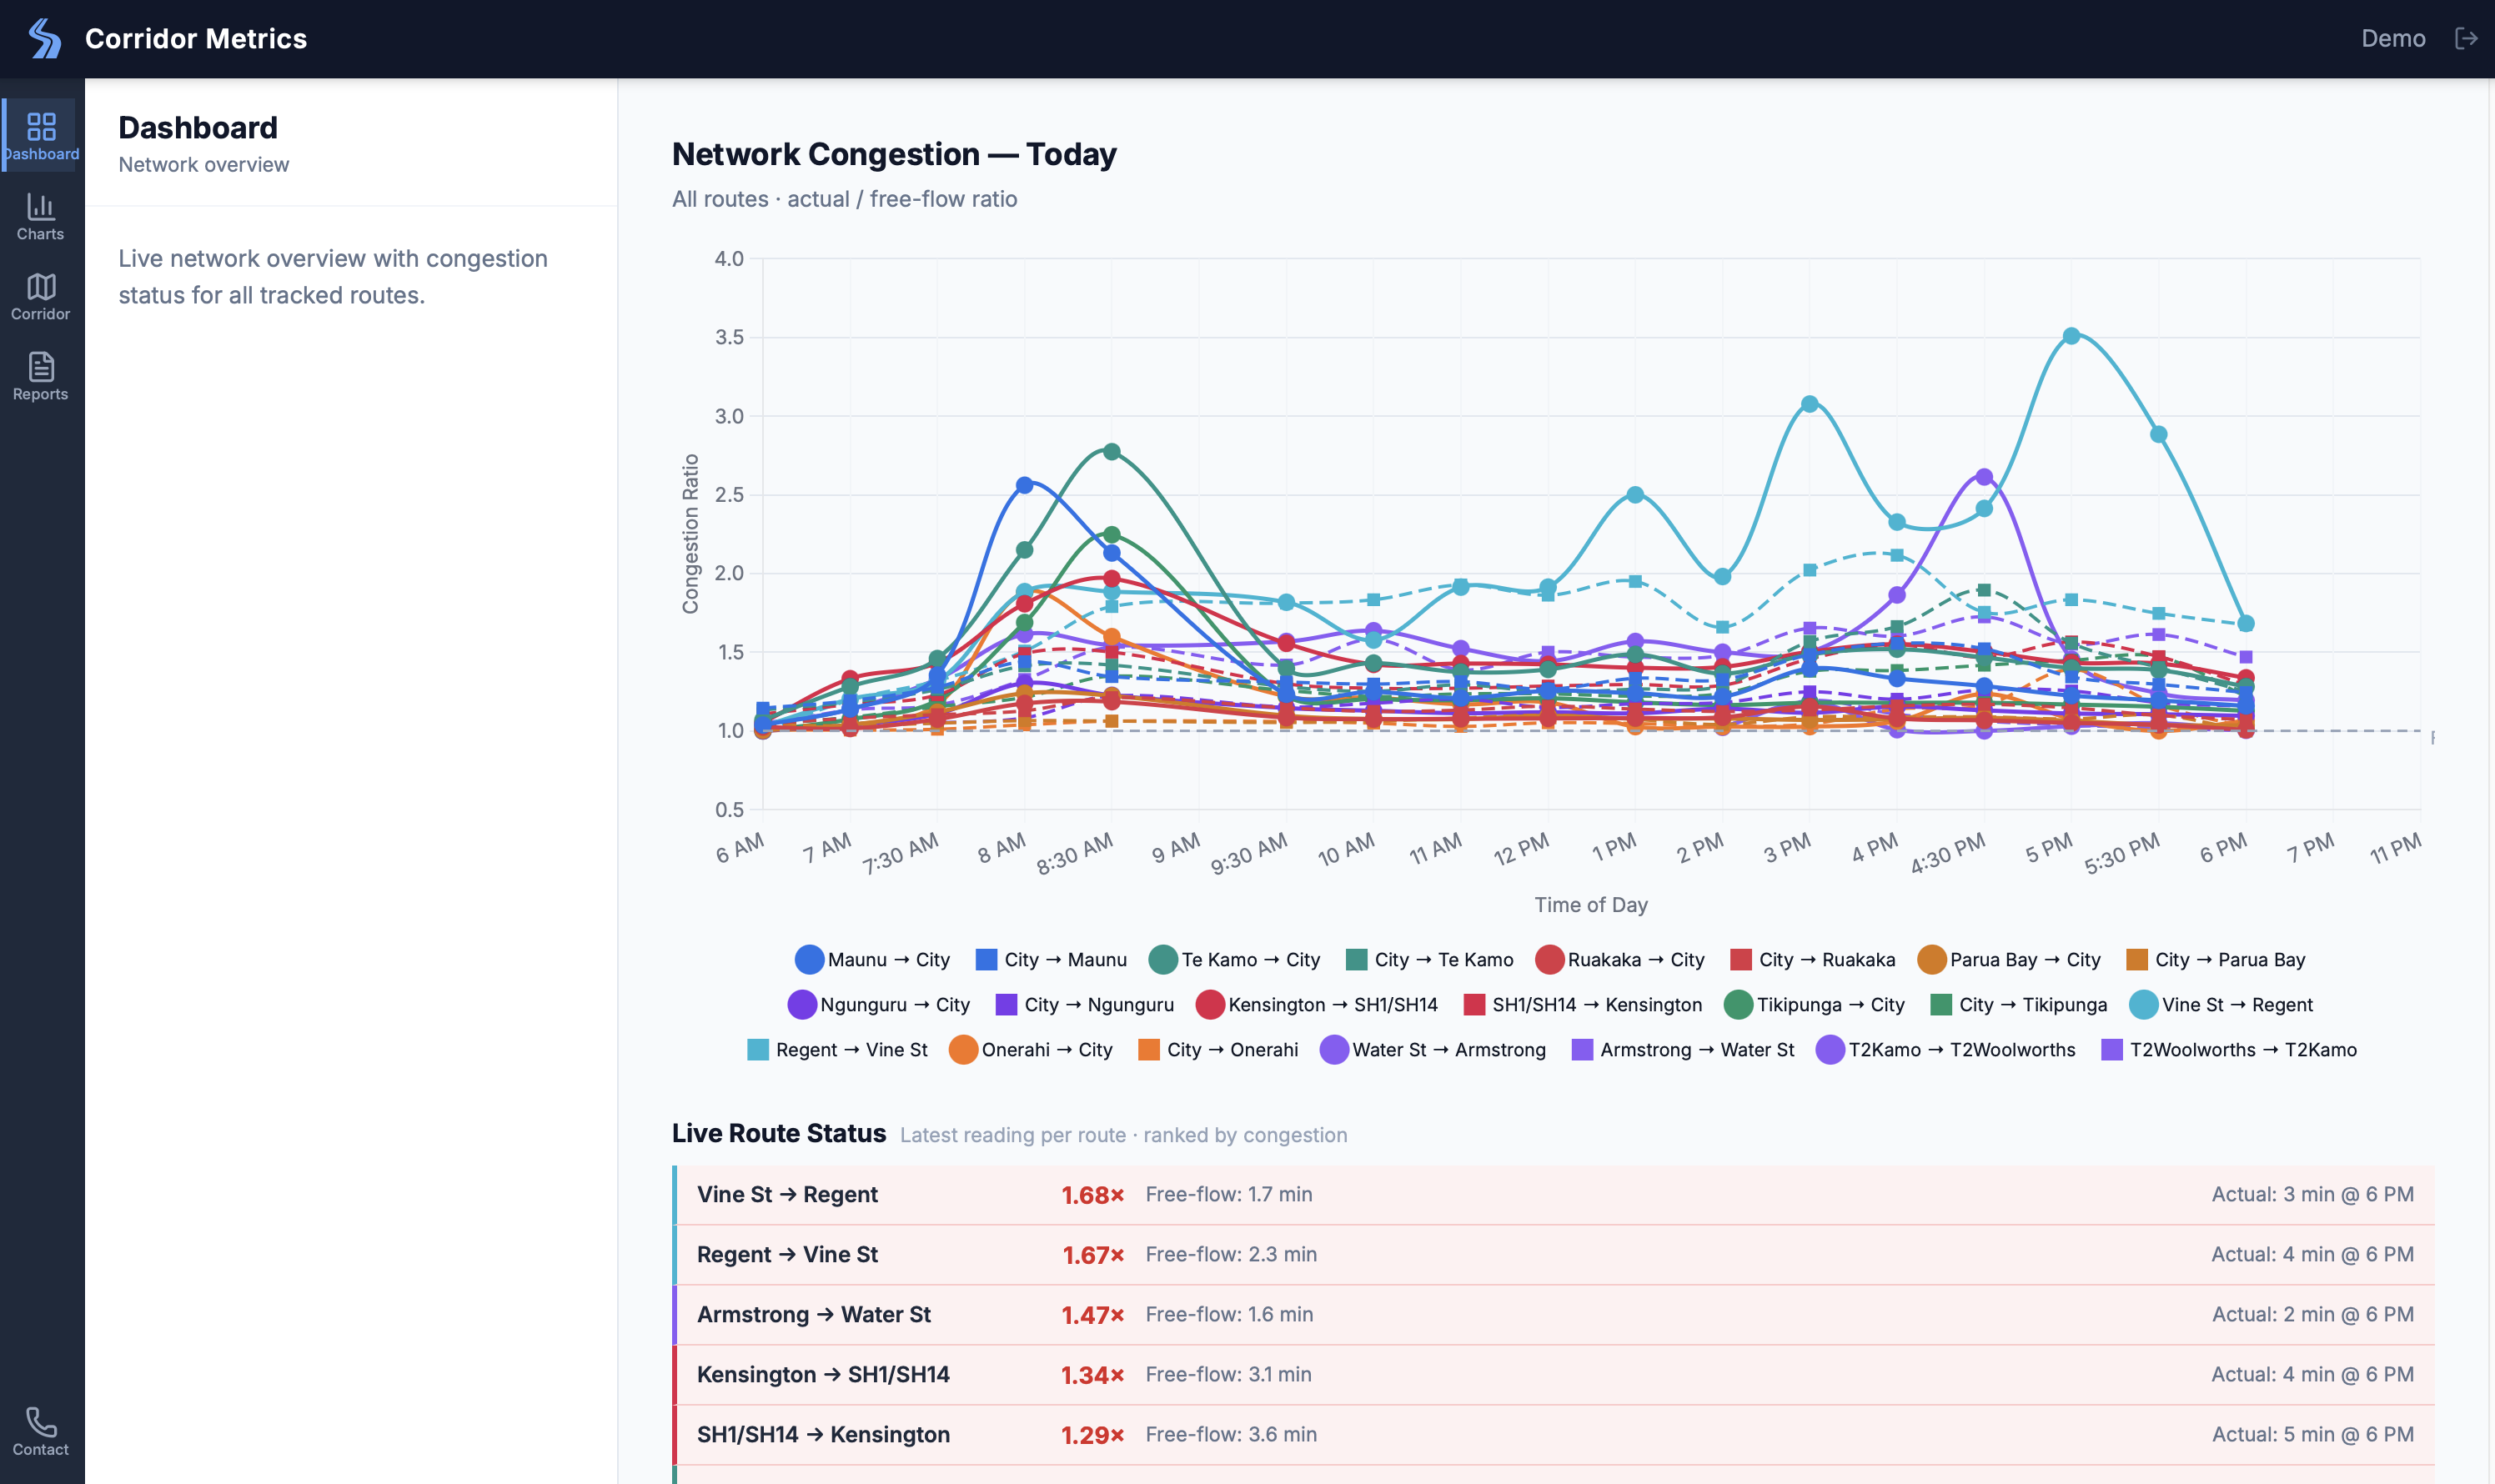
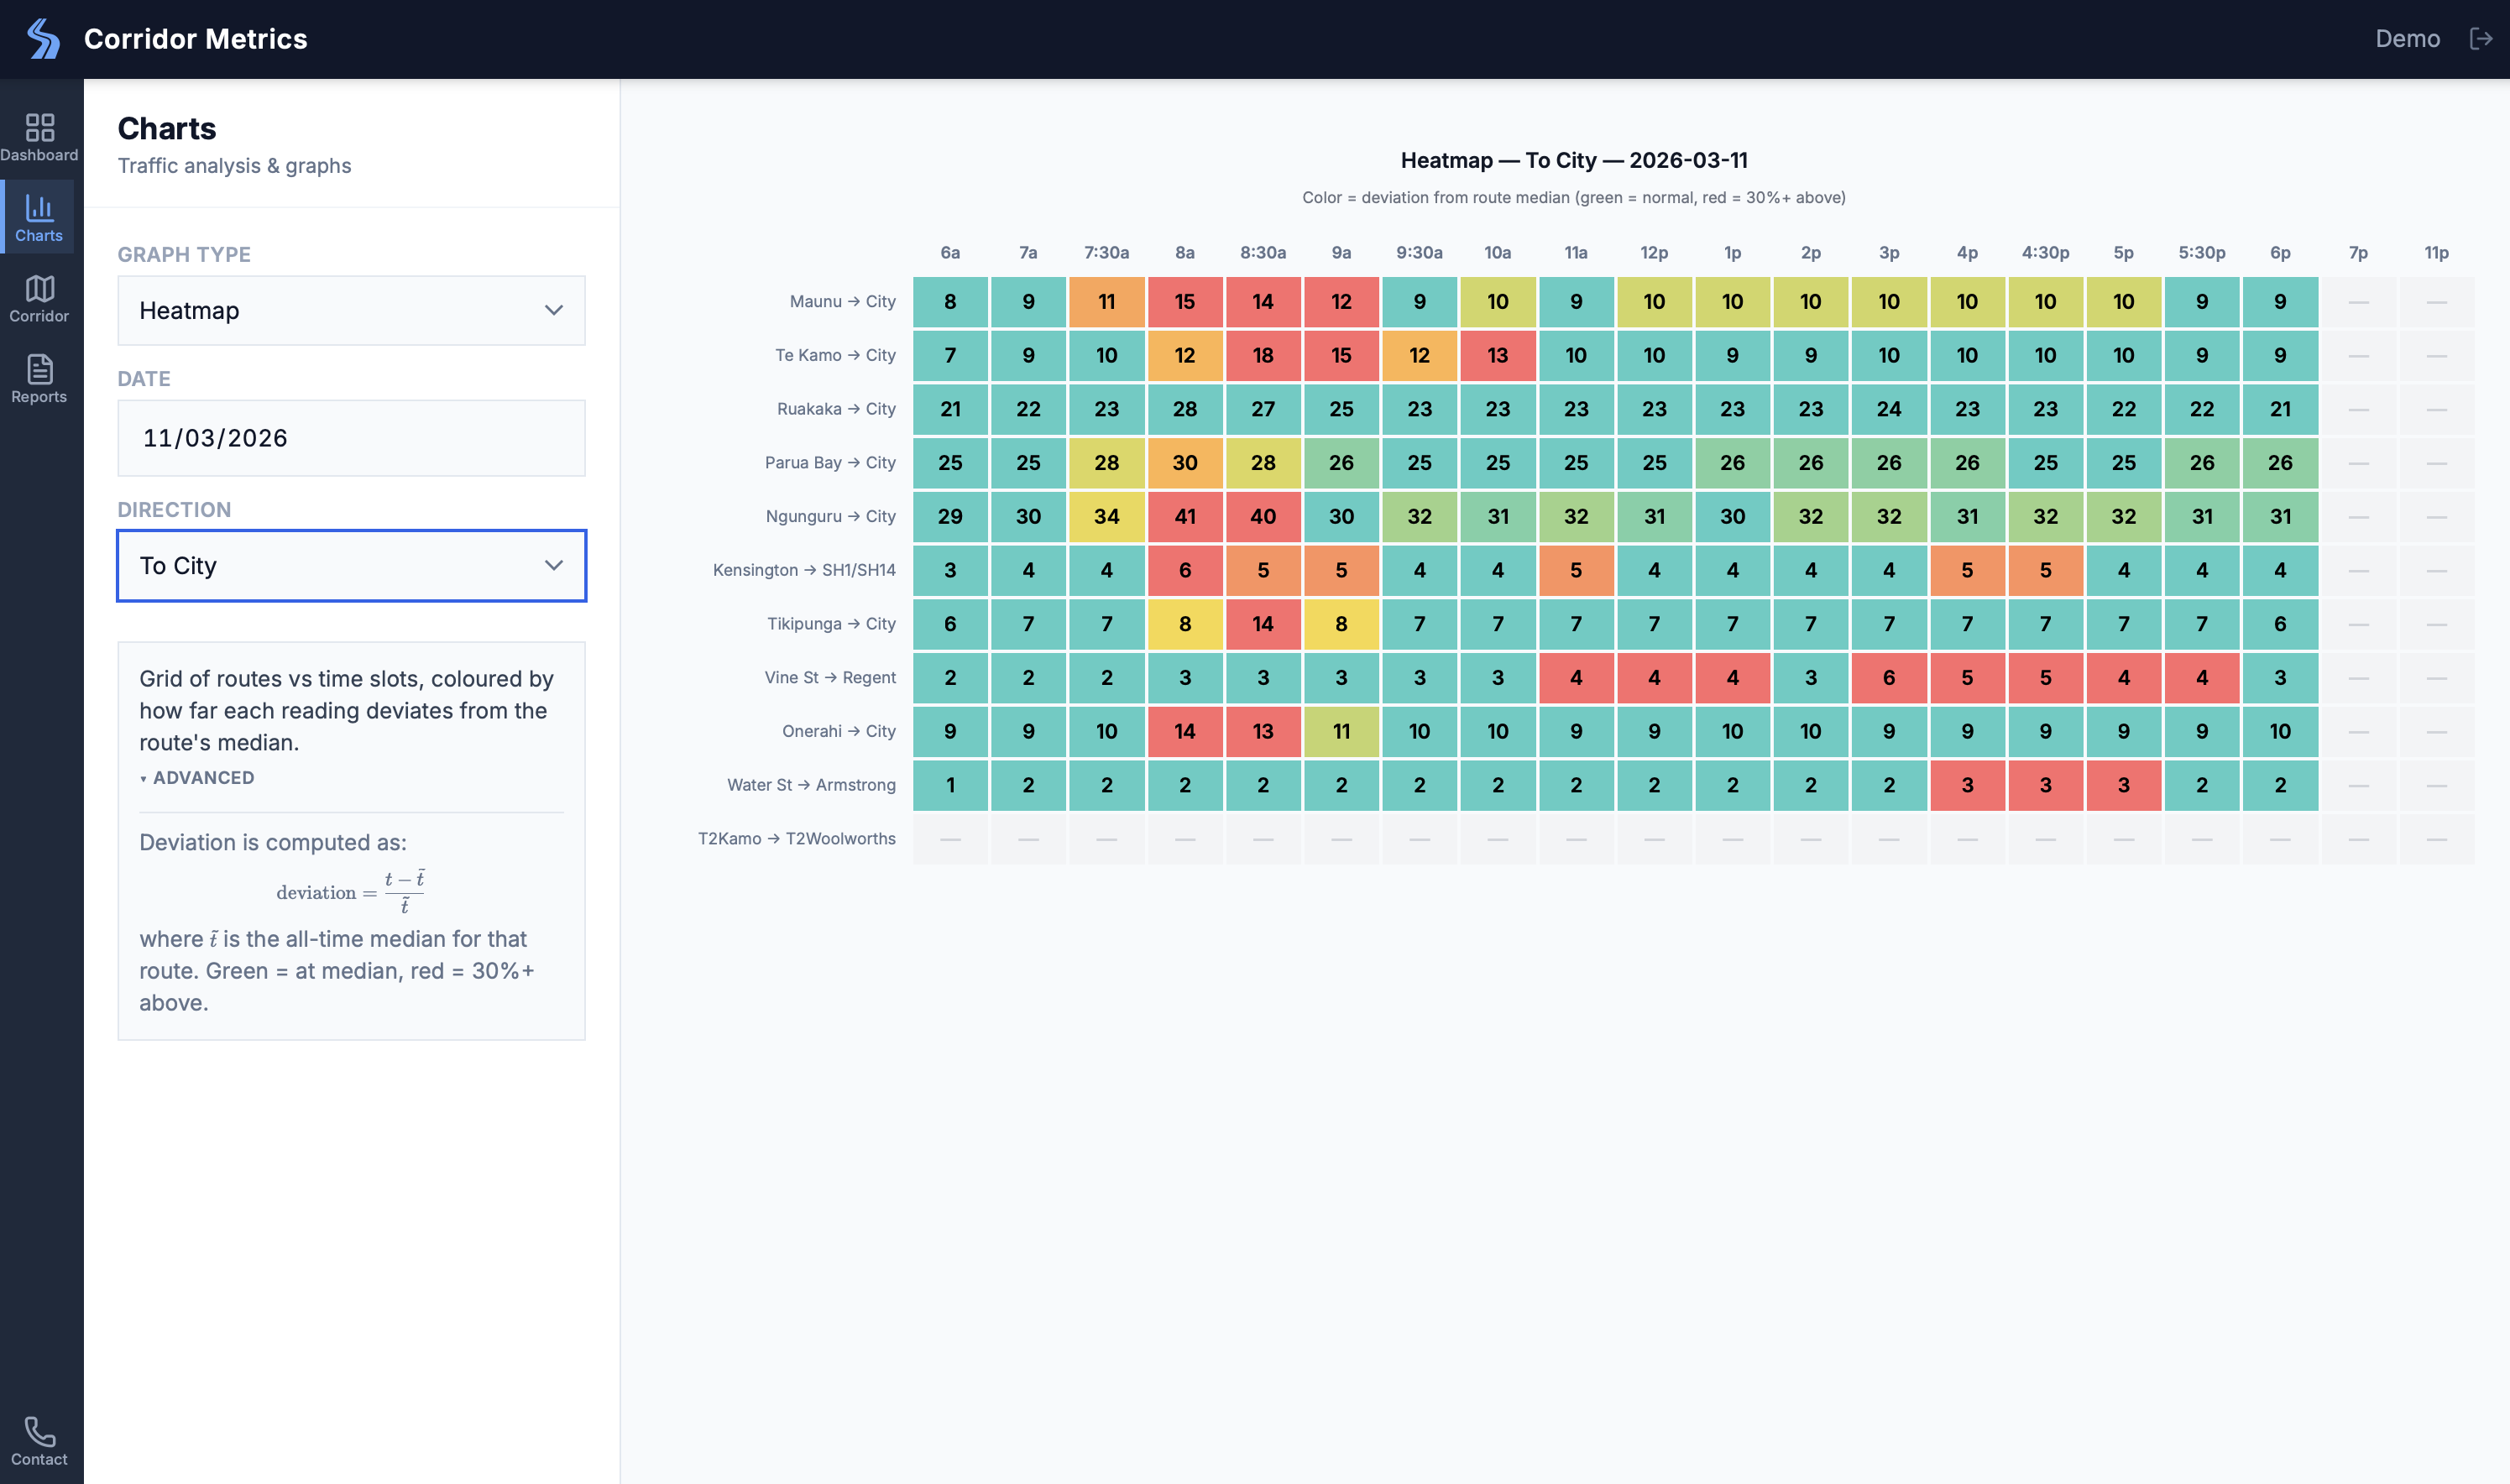
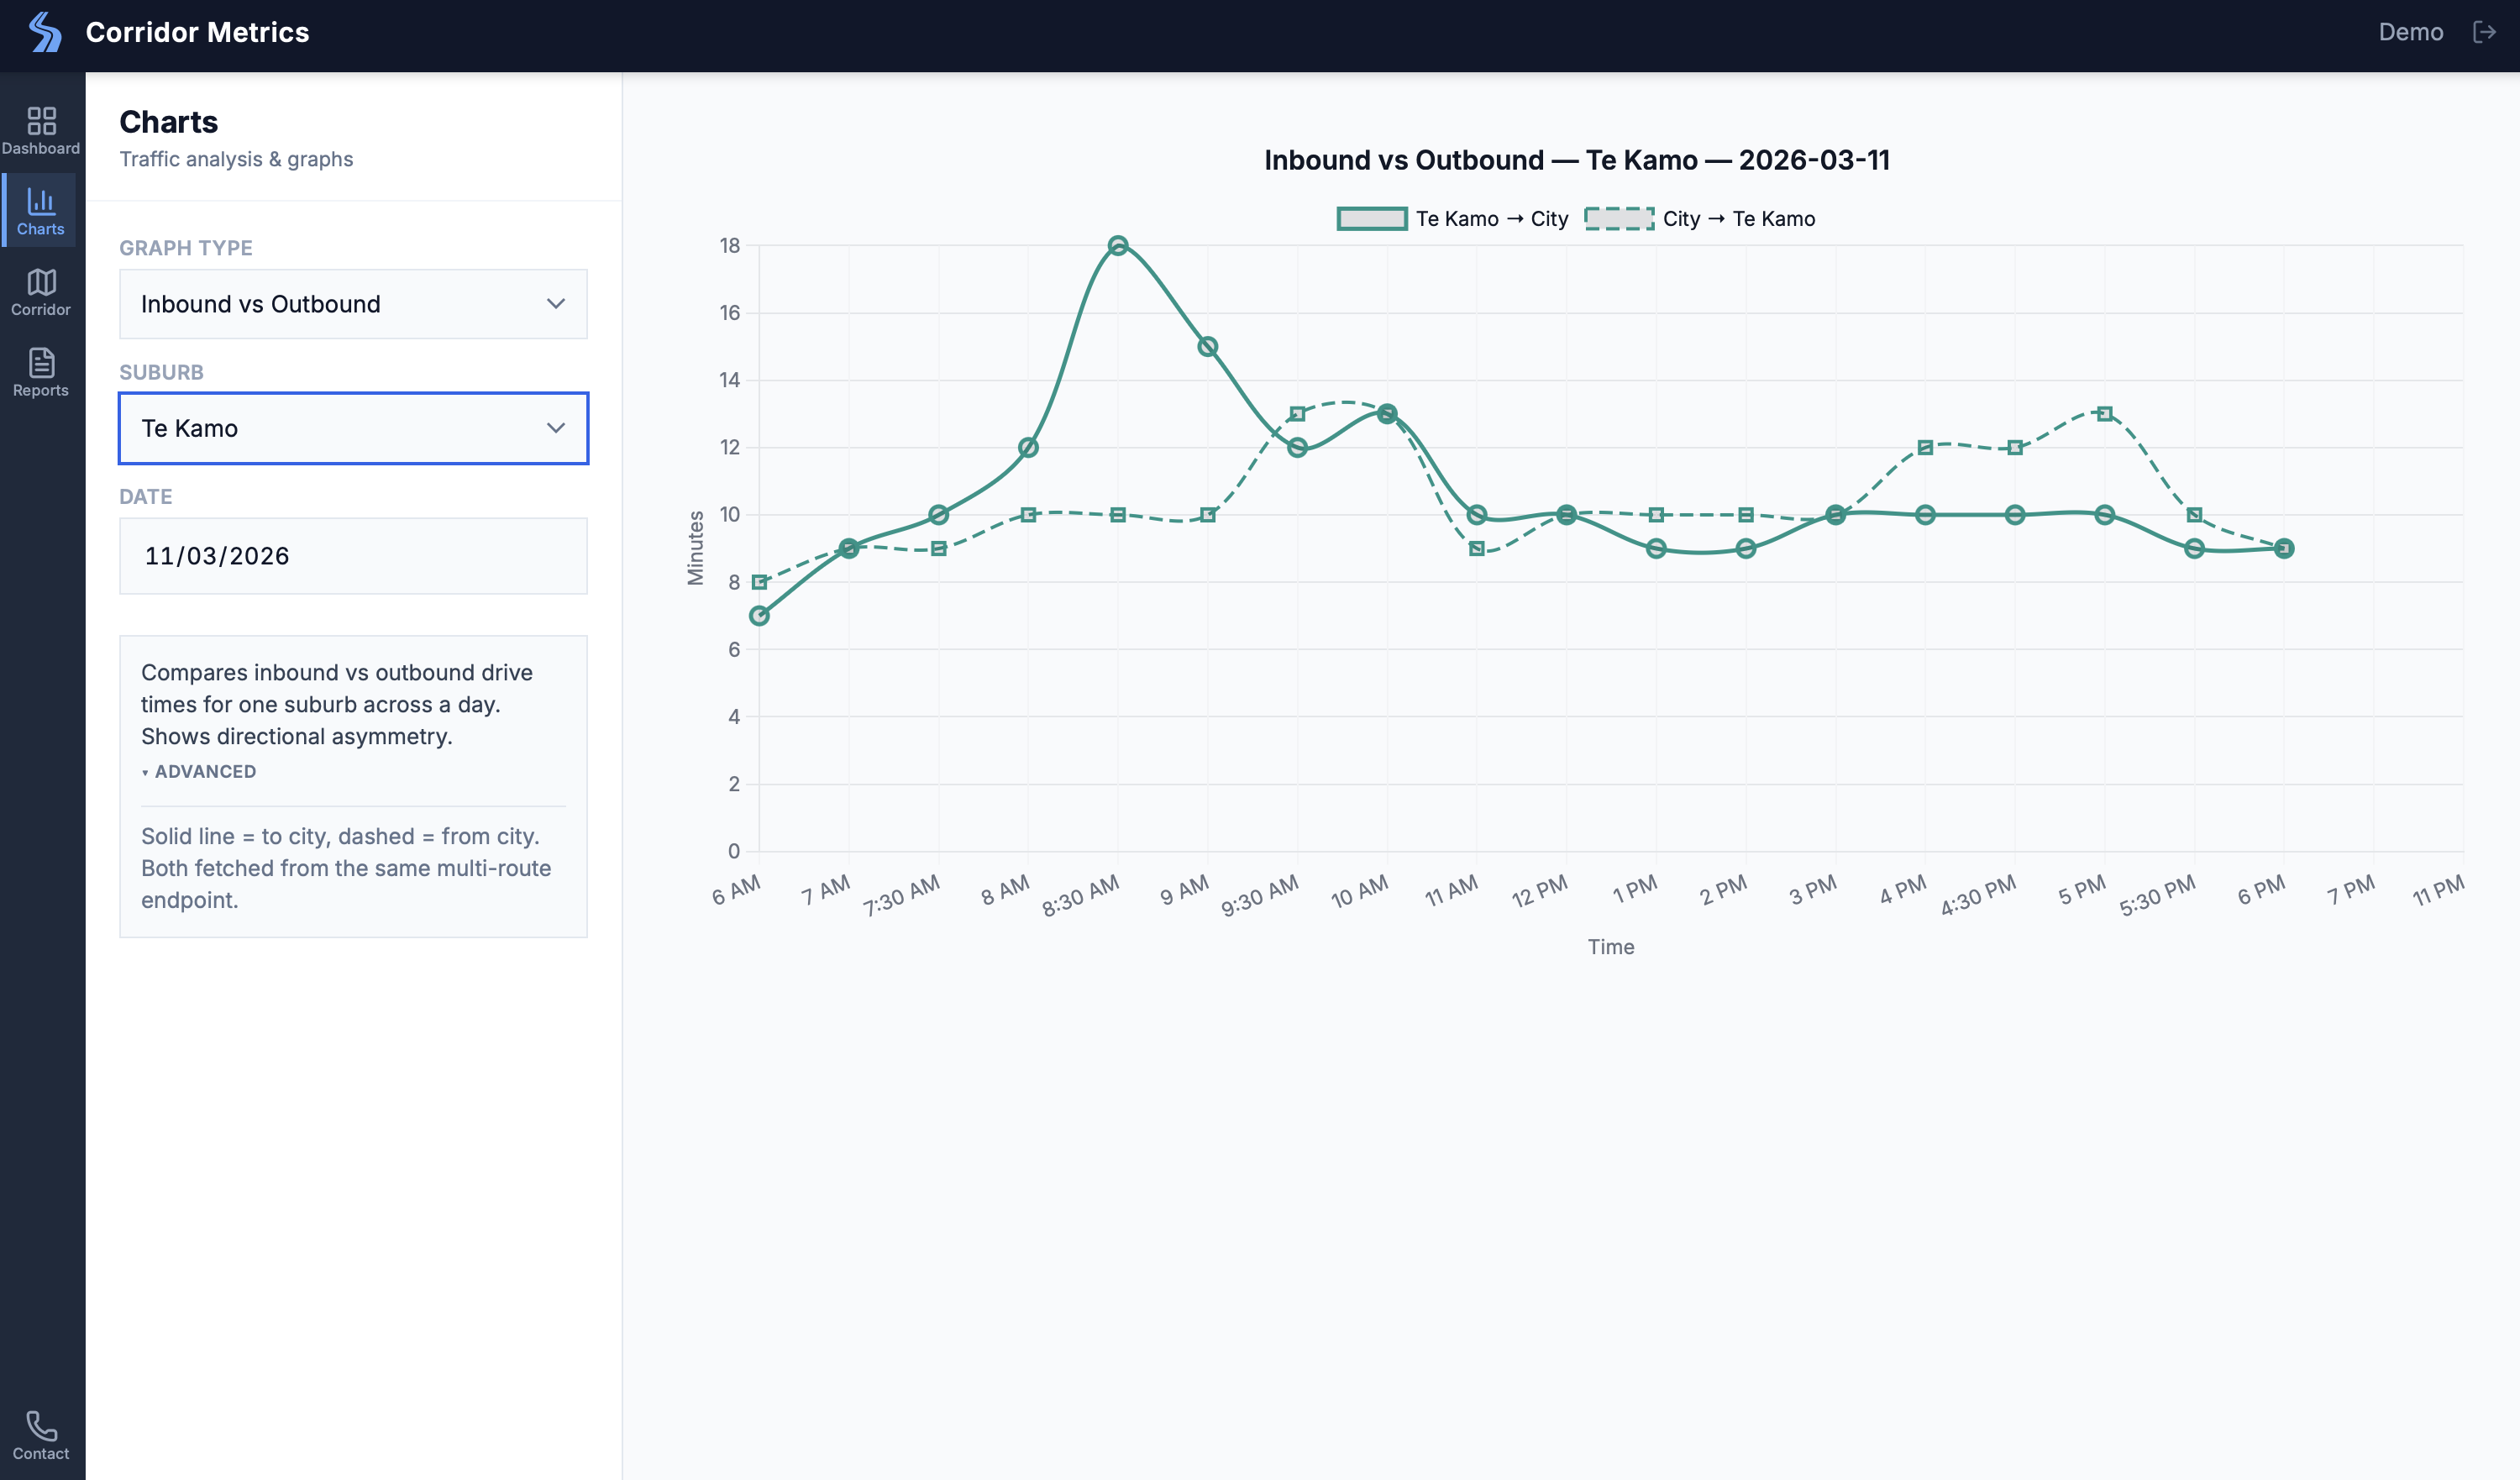
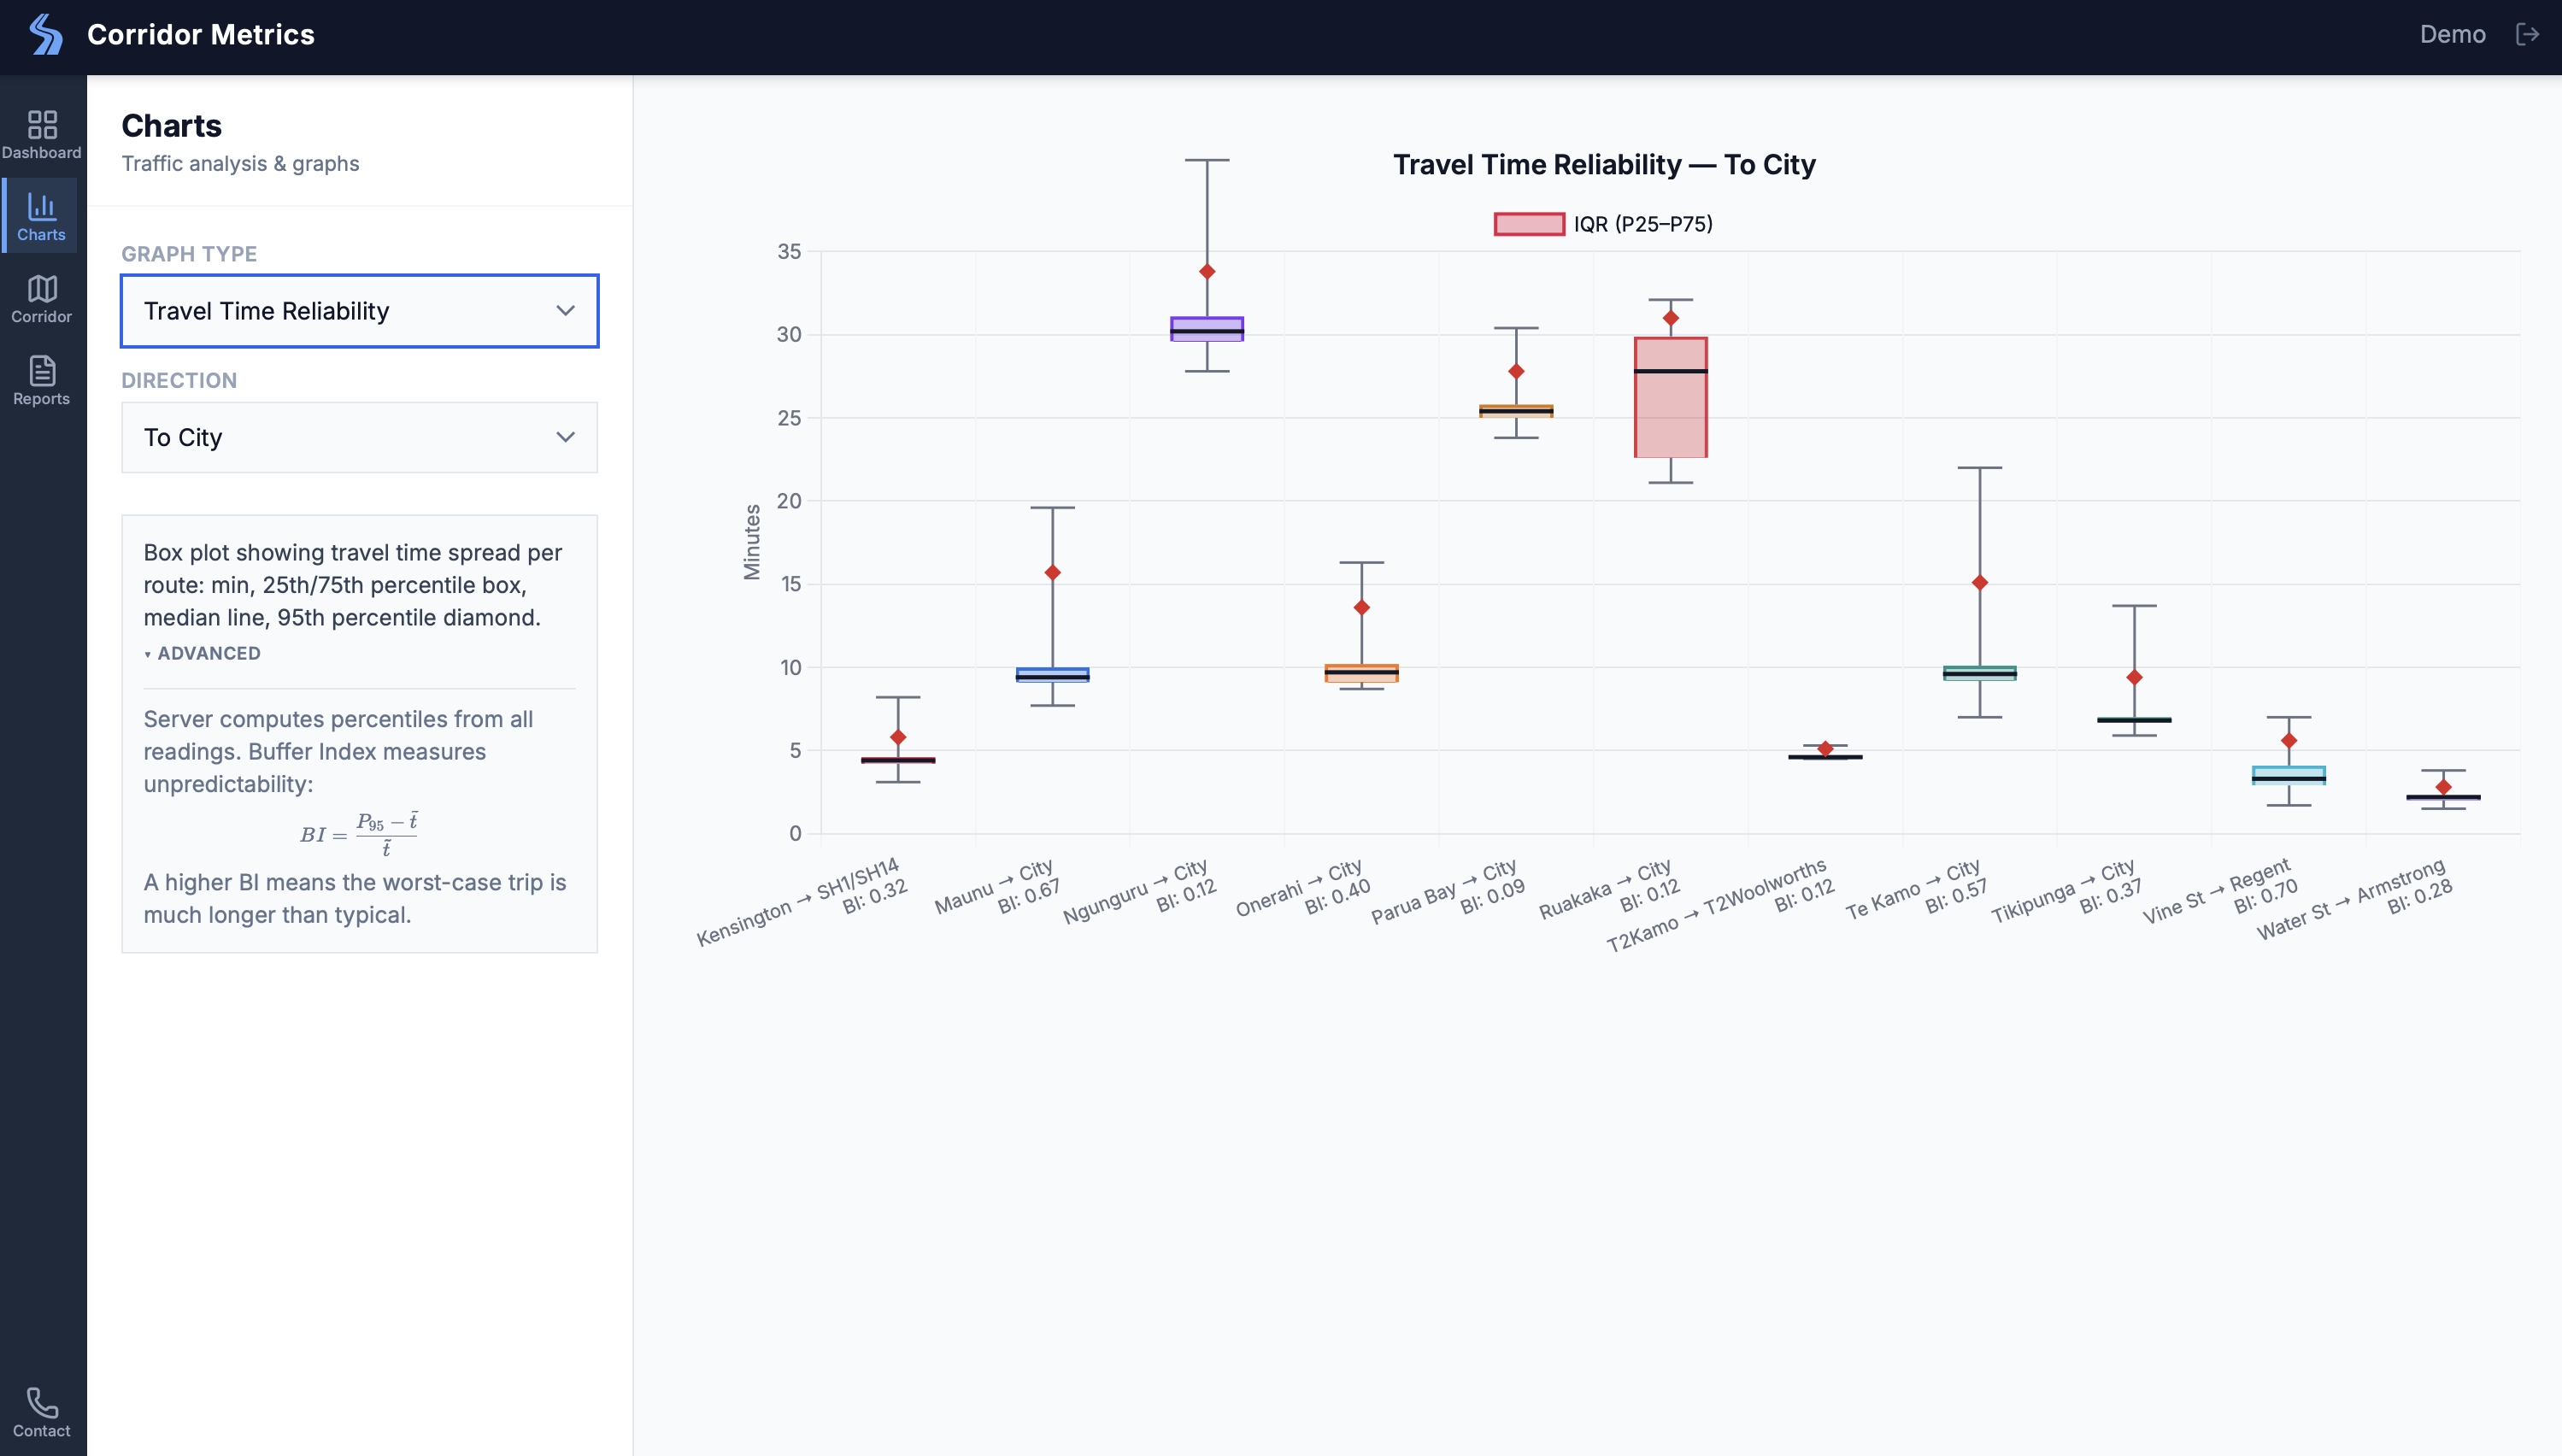
Corridor Metrics gives local government continuous travel time monitoring across their road network — without commissioning a corridor study.

Purpose-built for local government.

Corridor Metrics — live route monitoring map
The Problem

Traffic engineers at smaller councils are flying blind.

01

You make interventions. But do they work?

Speed tables, signal retiming, lane changes — councils invest in these every year. But without continuous before-and-after travel time data, you’re relying on gut feel and the occasional consultant snapshot.

02

Big-city tools aren’t built for you.

Platforms like StreetLight and INRIX are powerful — and priced for US state DOTs and metro planning organisations with dedicated data budgets. Local authorities need something that fits their scale and their team.

03

One-off studies don’t tell the whole story.

A traditional corridor study captures a single moment in time. What you actually need is continuous data: how does that corridor perform on a wet Tuesday morning compared to six months ago?

Capabilities

Continuous corridor intelligence, built for council.

Track travel times, congestion patterns, and queue lengths across your network — every day, automatically.

Route monitoring across your whole network

Track suburb-to-centre and point-to-point routes simultaneously. Data collection schedules are tailored to your network — with higher frequency during peak periods — so you see exactly when and where congestion builds.

Historical trends that reveal the full picture

Compare travel times week-over-week, month-over-month, or before and after a road intervention. Identify corridors that are slowly worsening before they become a problem.

Queue length tracking

Automatically identify contiguous slow segments to measure how far back congestion extends — giving you the data to justify signal timing changes, lane reconfigurations, or targeted works.

Weather correlation

Traffic data is recorded alongside weather conditions, so you can distinguish a genuine congestion trend from a wet-weather anomaly. Useful for separating signal from noise in your reporting.

Dashboard & Reporting

From raw data to council report in minutes.

  • Interactive heatmaps

    See which routes are congested and when — at a glance. Colour-coded by travel time deviation from free-flow conditions.

  • Time-series charts

    Track travel time trends for any route and date range. Overlay corridors to compare performance side by side.

  • AI-generated PDF reports

    Summarise corridor performance in engineer-style narrative language — ready for council meetings, stakeholder updates, or long-term plan submissions.

  • Multi-site support

    Manage monitoring across different areas or projects independently. Scale coverage as your network grows.

“The kind of report that used to take a consultant two weeks now takes two clicks.”

Use Cases

Built for the questions traffic engineers actually ask.

Scenario 01

“Did that speed table actually reduce travel times on the corridor?”

Set a monitoring window before installation and compare directly after. The data is there, continuous, and unambiguous.

Scenario 02

“Our council chambers keep asking about congestion. What can I show them?”

Pull an AI-generated PDF report for any route and date range. Narrative format, suitable for elected members who don’t read charts.

Scenario 03

“We need to prioritise our capital works. Which corridors are getting worse?”

Historical trend data across your whole network lets you rank corridors by travel time deterioration — giving you evidence-based prioritisation, not anecdote.

Why Local Government

Enterprise data intelligence. Local government pricing.

The big traffic analytics platforms were designed for US state departments of transportation — agencies with teams of analysts and seven-figure data contracts. Corridor Metrics was built from the ground up for councils where the traffic team might be one or two engineers wearing multiple hats.

No hardware or sensors
Cloud-based, minimal IT
Continuously updated data
Priced for local government
Traditional Approach Corridor Metrics
Setup Engage consultant, weeks of scoping Configured and live within days
Cost per corridor study Significant per-study cost Included in subscription
Data freshness Snapshot in time Continuous, daily
Reporting Weeks to produce Minutes with AI reports
Ongoing monitoring Not included Always on
How It Works

Reliable data. Proven infrastructure.

1

Routes are defined

Suburb routes (residential area to city centre, both directions) or corridor routes (point to point).

2

Data is collected automatically

Travel times and distances are recorded throughout each day, refined with polygon-based speed resolution at fine granularity along each segment.

3

You get the insights

Heatmaps, time-series graphs, queue visualisations, and AI-generated narrative reports — available any time.

No roadside sensors. No installation. No maintenance.

Get Started

See it on a corridor you actually manage.

The best way to understand what Corridor Metrics can do for your council is to see it running on your own routes. Book a short demo and we’ll walk you through live data — or set up a pilot on your network.

No hardware, no installation required
Live within days, not months
Pricing built for council budgets